Inside the First Half of 2026’s F&I Growth Engine
Updated: 22 hours ago
F&I PVR reached a new half-year high even as the measures that once explained its rise barely moved through June.
By Gregory Arroyo

For more than a year, StoneEagleDATA has documented the steady ascent of F&I profit per vehicle. The number climbed again during the first half of 2026. This time, however, the usual explanation was missing.
Dealerships were not suddenly placing substantially more products on every contract. The major product-penetration rates remained within the relatively narrow ranges seen during recent reporting periods. Yet the average dealership generated more F&I gross profit per vehicle retailed (F&I PVR) than in any six-month period since at least 2022.
F&I PVR reached $1,989, up 5.7% from $1,882 during the first half of last year. Average monthly F&I income per dealer increased 2.6% to $217,705, even as dealerships averaged 3.3 fewer deals per month.
The record, then, is only the beginning of the story. The more important question is what kept the F&I growth engine running when its most visible gauges barely moved.
Where Dealership Profitability Landed
F&I PVR reached its highest six-month average since at least 2022, while average monthly F&I income per dealer trailed only the second half of 2025. That strength arrived as the front of the deal continued to retreat.

Average front-end gross per deal fell from $765 during the first half of 2025 to $536 this year, a decline of 29.9%. Total gross per deal declined 4.6% to $2,525, its lowest first-half level since at least 2022.
F&I moved in the opposite direction, adding $107 per deal from a year earlier. That increase recovered nearly half of the $229 lost in front-end gross. Understanding how F&I produced that gain begins with the measure that once rose alongside it: products per deal.
The Dashboard Barely Moved
During the industry’s earlier F&I climb, the explanation was readily visible: dealerships were selling more products. Products per deal increased from 1.31 in 2019 to 1.56 in 2022 as F&I PVR rose from $1,327 to approximately $1,900. More products accompanied more income.
That relationship has since broken apart.
Products per deal stood at 1.55 during the first half of 2026 — virtually unchanged from the same period last year and slightly below the 1.57 recorded during the first half of 2022. Meanwhile, F&I PVR continued rising to a new high.

Penetration rates present a similar picture. Service contracts remained in the mid-40% range. GAP stayed near 39%. Paint-and-fabric protection hovered around 20%, while the other major categories generally remained inside the narrow bands established during recent reporting periods.
Small movements can still carry considerable weight. For service contracts, one percentage point across nearly 6 million first-half transactions would represent roughly 60,000 contracts. Even a fraction of a point can produce a meaningful change in product volume.
Yet the major penetration rates did not move together — or far enough — to account for the record. That shifts the inquiry from product volume to product economics.
The Economics Behind the Products
The clearest movement appeared in two categories that account for roughly two-thirds of the product-revenue picture: vehicle service contracts and GAP.
Compared with 2022, average service-contract income increased approximately 10%, while average GAP income rose about 13%. Those gains came without a comparable increase in penetration.
The environment surrounding those products has also changed.
Service contracts protect consumers against repair exposure, and that exposure has become more expensive. The Consumer Price Index for motor-vehicle maintenance and repair was 54.7% higher in June 2026 than in June 2019. It increased another 7% during the latest 12-month period, according to the U.S. Bureau of Labor Statistics.
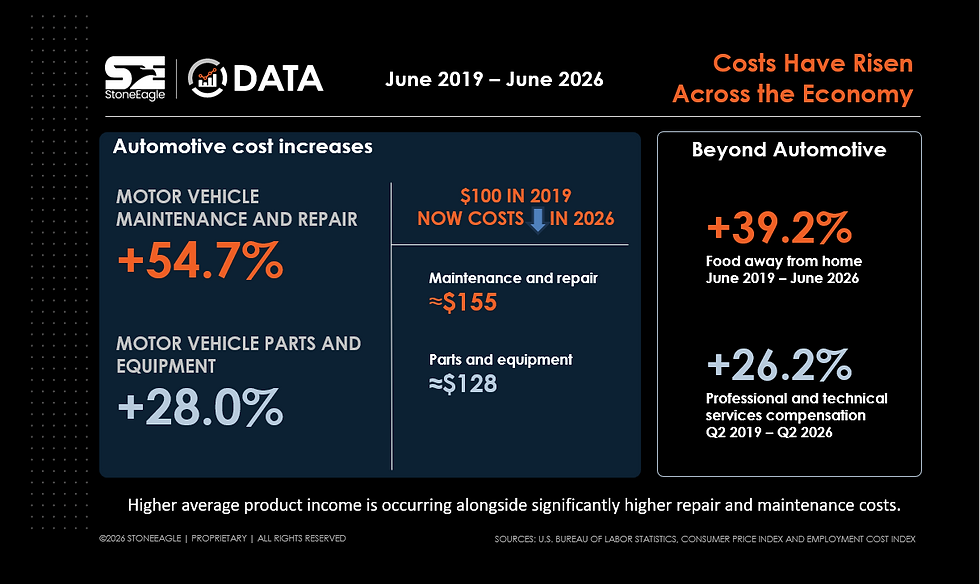
The index does not measure dealership product pricing, nor does it establish that rising repair costs caused the increase in F&I income. It does, however, provide important context for the changing economics surrounding service contracts and other repair-related protection products.
GAP follows a different risk. Its coverage is tied to the difference that can emerge between a vehicle’s value and the balance owed after a total loss. As vehicle costs and financed balances rise, the amount at risk can rise with them.
The product side supplied most of the answer. Financing added another piece.
Finance Provided a Secondary Lift
Finance activity added support, although the larger movement remained on the product side.
Compared with the second quarter of 2025, the average amount financed increased by $2,023 to $38,221. Finance deal penetration rose 1.3 percentage points to 75.8%, meaning a greater share of buyers financed through the dealership. Average finance reserve increased by $32 to $909.
Those gains occurred even as average dealer markup declined from 2.28 to 2.13 percentage points.

The combination matters. Dealers captured financing on a larger share of transactions, and those transactions carried higher average balances. That helped reserve income advance despite the lower average markup.
The finance gains supported second-quarter performance. They did not account for most of the first-half increase.
F&I Is Carrying More of the Deal
The longer comparison shows how dramatically dealership profit composition has changed.
During the first half of 2022, the average deal produced approximately $2,628 in front-end gross and $1,923 in F&I PVR. Four years later, front-end gross was nearly 80% lower, while F&I PVR was 3.5% higher.
As a result, F&I accounted for approximately 79% of total gross per deal during the first half of 2026, compared with about 42% four years earlier.
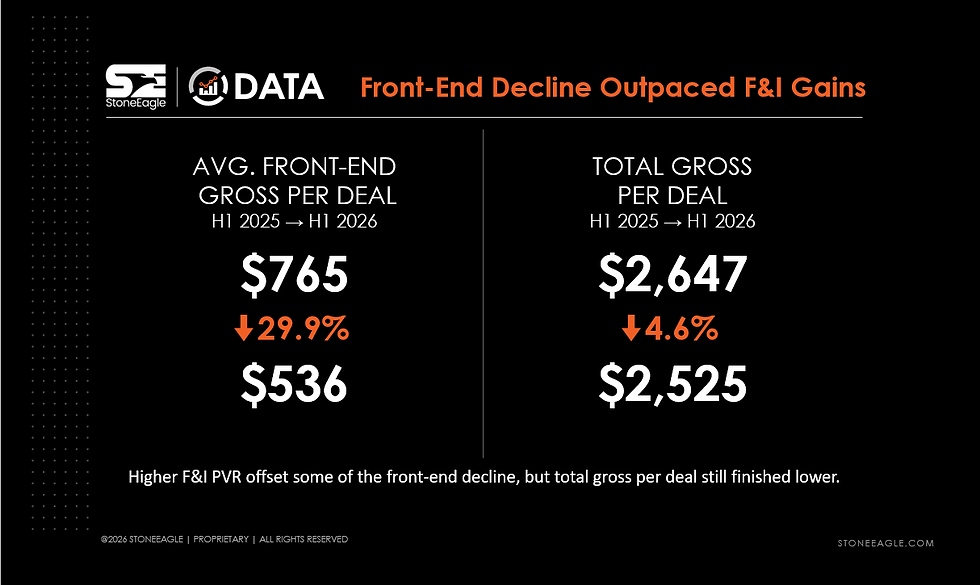
That shift is the clearest measure of F&I’s changing role in dealership profitability. It is no longer supplementing the same level of front-end gross. It is carrying substantially more of the average deal.
StoneEagle CEO Cindy Allen examines the full results in the video above, including the product categories behind the increase, the outside cost pressures reshaping protection economics and the finance trends influencing today’s transactions.
That's The Complete Picture. Brought to you by StoneEagle. Your one true source for benchmarks and data that help drive success for your business.
StoneEagleDATA is part of StoneEagle’s broader suite of connected solutions — including StoneEagleMENU, StoneEagleMETRICS F&I, Pencilwrench, and StoneEagleMETRICS Service — helping dealers make smarter decisions across F&I, sales, and service.


The gap between flat product sales per deal and rising profit is the interesting part here. Could you break down how much came from higher prices versus changes in which products customers bought?
Separately, sharing an off-topic resource: betfm.com has a page about Perfect Pairs in blackjack.
Ragarding https://wells-fargo.pissedconsumer.com/review.html I had the pleasure of using Wells Fargo Financial Services, and I must say, my experience was fantastic! The customer service team was incredibly friendly and attentive, making me feel valued as a client. The online platform is user-friendly and intuitive, allowing me to manage my finances with ease. I was pleasantly surprised by the variety of financial products available, which catered perfectly to my needs. Overall, I left feeling empowered and confident in my financial decisions!
Looking at growth numbers is cool, but figuring out how money actually moves behind the scenes is what matters to me. Whenever I track new projects, I try to understand basic token flows first so I don't get lost in all the tech hype. Finding straightforward information can be annoying, but checking out a guide hypeusdt.co really helped clear things up regarding the HYPE to USDT pair and how liquidity works there. Having a simple informational resource to read through makes following these market trends way easier and less confusing