The Industry Standard Just Got Better.
Meet the new StoneEagleMETRICS experience, with the performance data you need in a view you control. Put your results in context with national averages and top-performing dealers to set more informed goals. Always-on AI monitoring makes data hygiene part of everyday reporting.




INDUSTRY’S MOST POWERFUL F&I BENCHMARK DATA
Better Performance Starts with a Better Benchmark.
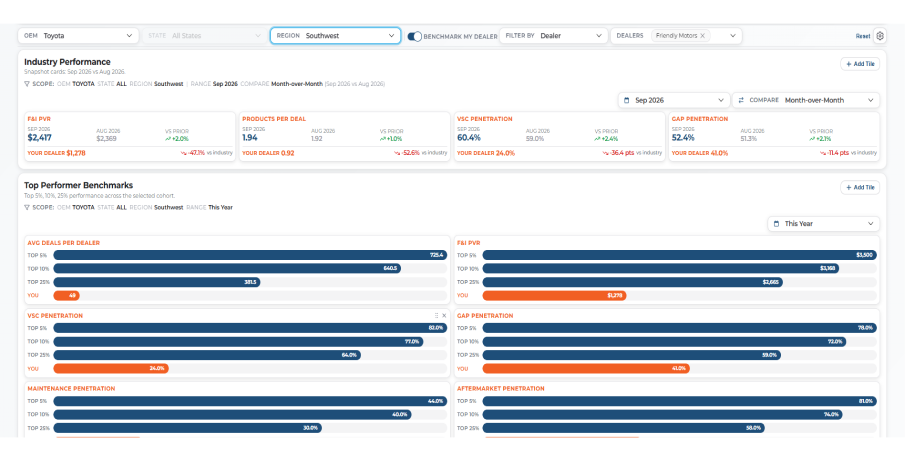
You can't chase a standard you can't see. Industry Benchmarks
shows you what top-performing dealers are achieving, where your operation stands, and where the next opportunity lies.
Explore industry averages based on aggregated F&I data from nearly 10,000 dealerships nationwide. Filter by OEM, state, or region, then turn on Benchmark My Dealer to see exactly where you stand.


INDUSTRY FIRST | 24/7 INTELLIGENT MONITORING
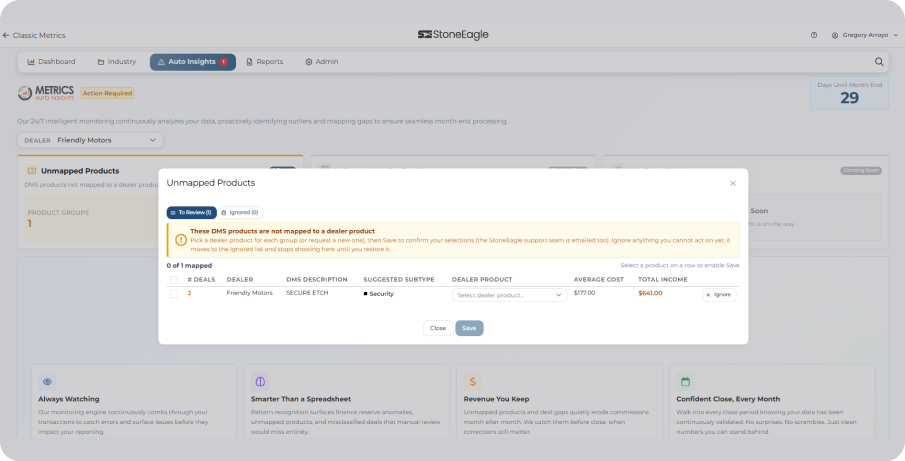
AUTO INSIGHTS
You shouldn’t have to wait until month-end to discover something needs attention.
AUTO INSIGHTS proactively monitors dealership data in StoneEagleMETRICS, bringing potential concerns forward throughout the month so your team can review them sooner.
Built on nearly 40 years of dealership data expertise, AUTO INSIGHTS uses always-on AI monitoring to recognize unusual patterns, investigate potential causes, and recommend actions.


Turn F&I Complexity Into a Simple, Profitable Presentation
StoneEagleMENU pulls buyer, vehicle, and deal data straight from the DMS, then applies pricing, terms, and coverage details across your entire product lineup in seconds.

5 SECONDS TO FULL PRICING
All your connected F&I product rates load instantly.
LEARN IT FAST. PRESENT EVEN FASTER
F&I managers are trained & up to speed in under 30 minutes. Presentations take just 30 seconds to start.
CUSTOMER READY LAYOUTS
Modern, compliant & confidence building StoneEagleMENU helps turn customers into believers.

NO DMS PING
PONG
Edit key deal details directly in the menu app without jumping back and forth.

SALES DASHBOARD
Start Every Day Knowing Where You Stand.
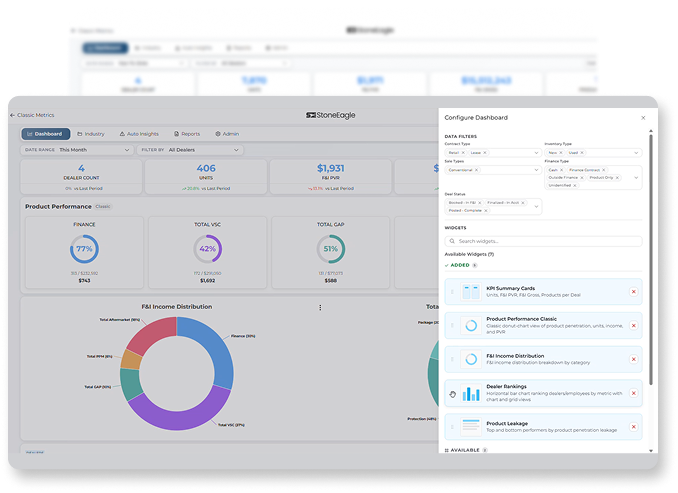
Easily build a dashboard with the KPIs, trends, stores, and operations you need to manage.
StoneEagleMETRICS Sales Dashboard shows performance at a glance, identifies where attention is needed, and gives your team a shared view of the numbers driving the business.
Get from the Big Picture
to the Details Behind It.
More than 40 reports connect sales volume and deal profitability with the people, finance sources, F&I products, and customers behind your results.
Move from operation-wide performance to individual deals, customize the information that matters to your team, and put actionable intelligence in the hands of the people who can use it.